
Description
SPM Calibration Specimens
Overall Benefits:
– Easier testing of your SPM.
– Improved accuracy of critical dimension measurements.
– Accuracy: 0.5% (1 std. dev.).
Features and Benefits:
– Holographic fabrication – assures high accuracy and precision.
– Pattern height > 100nm – provide excellent image contrast.
– Uniform coverage of entire chip – save time (can image anywhere).
Description:

– Nominal calibrated dimensions: 300 or 700 nm.
– Calibration certificate: supplied with each sample, stating the dimension to the nearest 1 nm.
– Pattern types: 1- or 2—Dimensional. The calibrated dimension is the same for both axes for the 2-D standard.
– Feature geometry:
– parallel ridges (1-D, 300 or 700nm)
– cylindrical posts (2-D 300nm)
– diamond-shaped posts (2-D 700nm)
– Physical Size: 3 mm x 4 mm x 0.5mm.
– Substrate: Silicon wafer.
– Top surface: Tungsten film.
The 1-D standards can be scanned using any AFM mode, including contact mode. The 2-D standards can be scanned using modes such as Tapping Mode™, intermittent contact, and non-contact.
Model 150-1D
Accurate measurements of sub 0.5 micron features are increasingly important as nanotechnology develops an d as conventional microfabricated structures (semiconductors, magnetic data storage devices, optical data discs) shrinking. The model 150-1D with a nominal period (pitch) of 150nm, one dimensional, fabricated on a transparent substrate (Aluminum lines on glass) is the new tool to support this work.
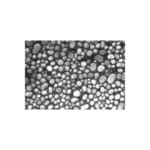
Model 750-HD

High Durability Calibration Reference Specimen for AFM and STM
Each specimen is supplied with a calibration certificate. Can be used for AFM, STM and SEM. Has been used successfully in a hot water AFM.
| Nominal pattern dimensions | Pitch 750 nm |
| Height 100 nm | |
| Nominal specimen dimensions | 6.35 nm diameter, 0.3 mm thick |
| Composition | Solid Nickel |
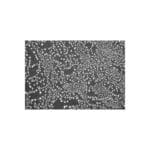
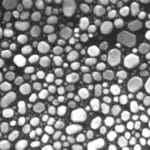
Model PT
Phase Imaging Test Specimen (verify TappingMode™ phase contrast and resolution).
Phase Imaging is a sharp probe, which is brought into proximity with the specimen surface. The probe is oscillated vertically near its mechanical resonance fre-quency. As the probe lightly taps the surface, the amplitude of oscillation is reduced and the AFM uses this change in amplitude in order to track the surface topography. In addition  to its amplitude, the probe motion can be characterized by its phase relative to a driving oscillator. The phase signal changes when the probe encounters regions of different composition. Phase shifts are registered as bright and dark regions in phase images, comparable to the way height changes are indicated in height images.
Phase images often show extraordinary contrast for many composite surfaces of technological and scientific interest. These include contamination deposits, discontinuous (i.e. defective) thin films, devices built of composite materials (e.g. magnetic recording heads), and cross-sectional specimens of composite materials. Both inorganic and organic materials can be examined. We have found that phase imaging is more convenient and gentler than other methods, which are based on contact mode operation. It routinely achieves lateral resolution of 10 nm.
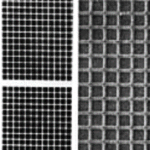
Models 300-2D, 300-1D, 700-2D and 700-1D
All mounted on 15 mm steel disk.
Models 300-1D and 300-2D

Parallel Ridges
Pitch 288
W-coated Photoresist on Si
use contact or TappingMode
Models 300-2D

Array of Posts
Pitch 297
Al bumps on Si
use contact or TappingMode
Models 700-1D

700-1D
Parallel Ridges
Pitch 700
W-coated Photoresist on Si
use contact or TappingMode
Models 700-2D

700-2D
Array of Posts
Pitch 700
W-coated Photoresist on Si
use TappingMode
References
1. Pereira, D.E.D. & Claudio-da-Silva, Jr., E. “Improvement of AFM as an analytical Instrument for Residual Lignin Characterization” in: Proceedings International Symposium on Wood and Pulping Chemistry, Helsinki, Finland, June 1995.
2. Pereria, D.E.D, Chernoff, D., Claudio-da-Silva, Jr. E., & Cemuner, B.J., “The use of AFM to investigate the delignification process: Part I –AFM performance by differentiating pulping processes”, to be published.

Avis
Il n’y a pas encore d’avis.